Links
HomepageStock List
Search by Ticker
News
Login
News
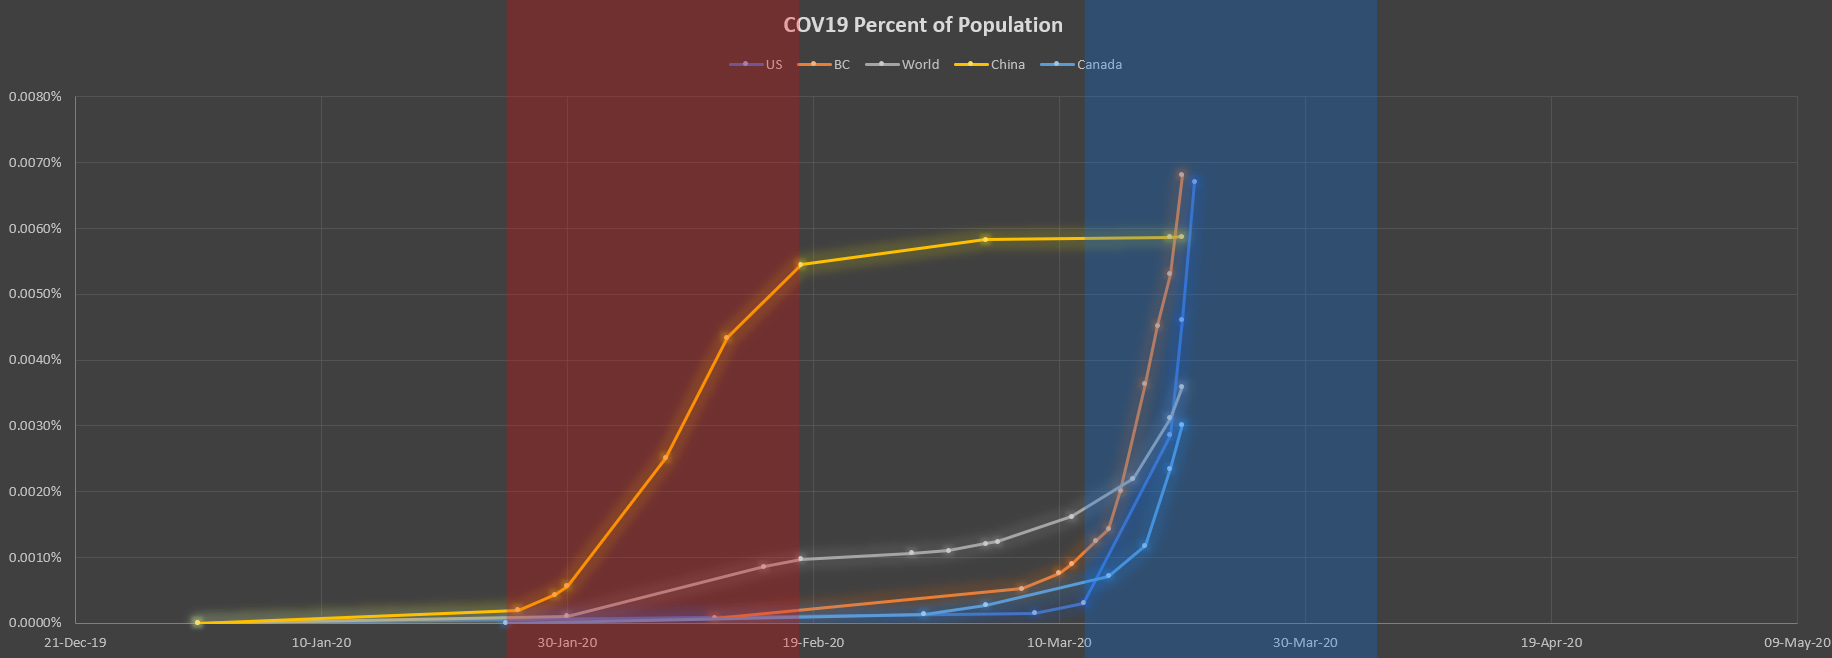
COVID 19 China Recovery Compared to US and Canada
March 21, 2020
China has implemented measures to slow down COVID 19. It took roughly 22 days after quarantine to cause the slow down. The below graph shows the current trend of COVID 19 in the US and Canada compared to China and the world as a function of population. This data suggests it should start slowing down at the beginning of April 2020.
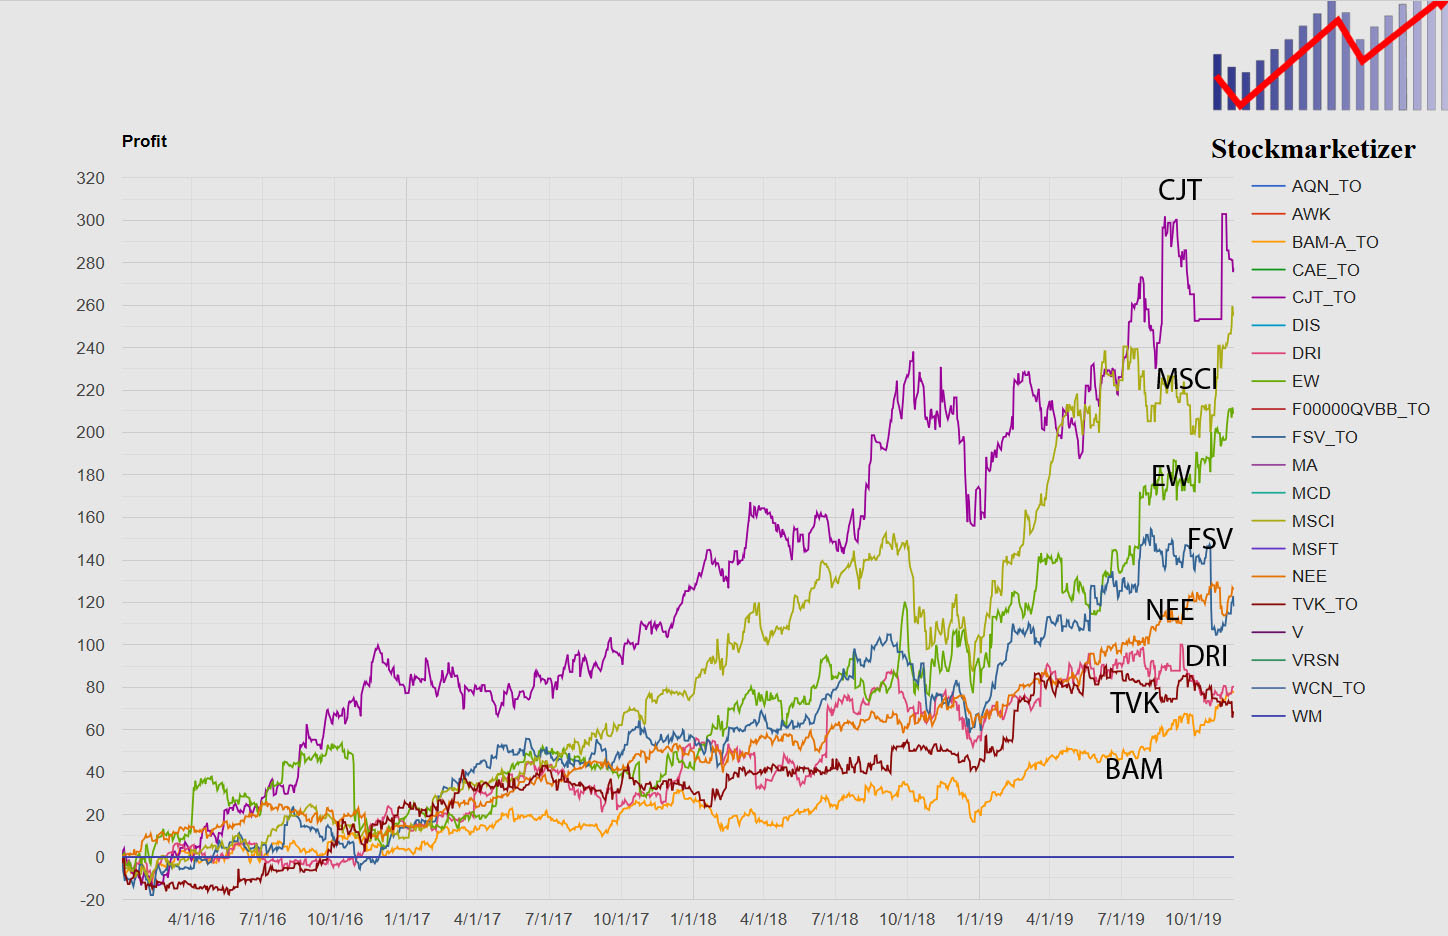
CargoJet (CJT.TO) High Growth
November 21, 2019
Cargojet (CJT.TO) has had impressive growth, can it continue? The trend since 2016 has been fairly consistent and has outperformed medical stocks like Edwards Life Sciences (EW).
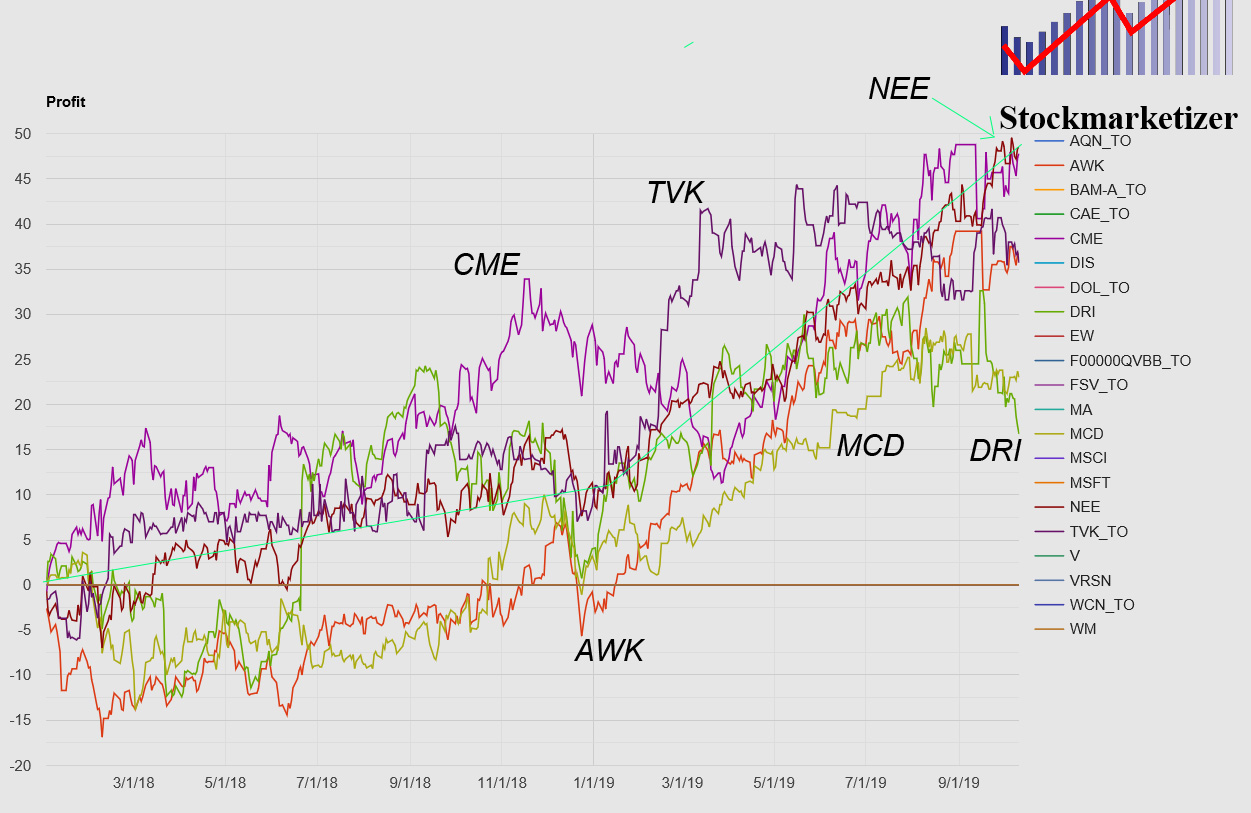
Nextera (NEE) Steady Performer
October 10, 2019
Nextera Energy (NEE) has been a steady performer over the past two years compared to related stocks that have had more volatility. The graph below shows how NEE did compared to American Water Works (AWK), CME Group (CME), Darden Restaurants (e.g. Olive Garden) (DRI), McDonalds (MCD), and Terravest Industries (TVK.TO).
US Stock Top Performers
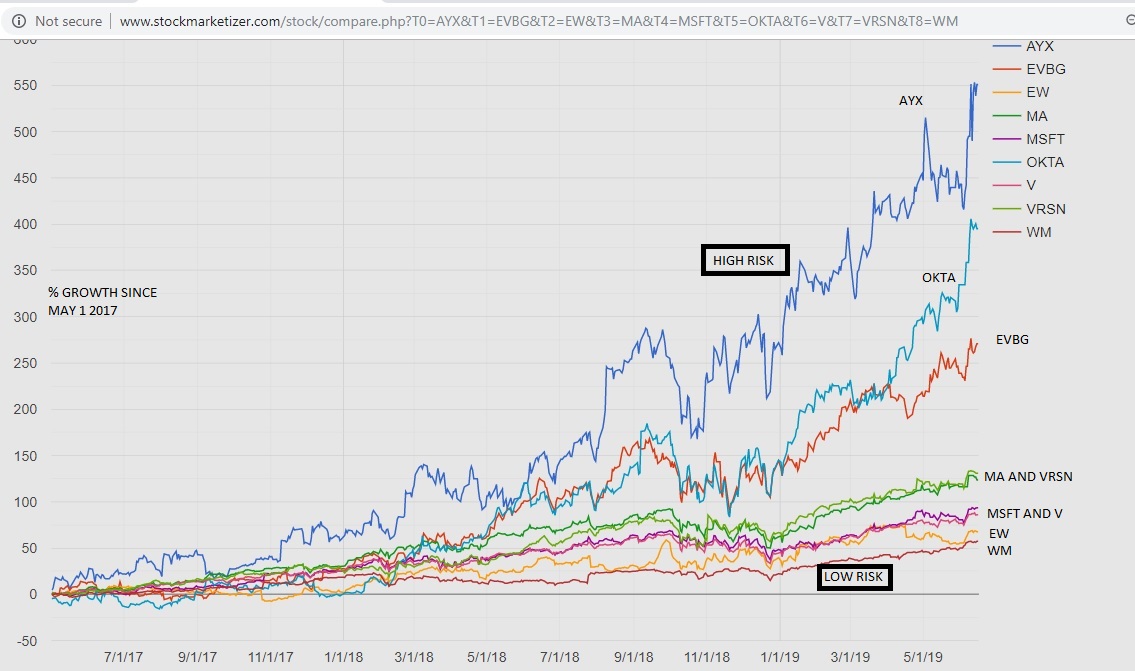
June 16, 2019
The below graph shows a list of US stocks that have resulted in at least 50% growth over the past 3 years. The 3 more risk/reward stocks are AXY, OKTA and EVBG. The safer but still steady performers are MA and VRSN, MSFT and V, EW, and WM.
Visa Up 50% Since 2018
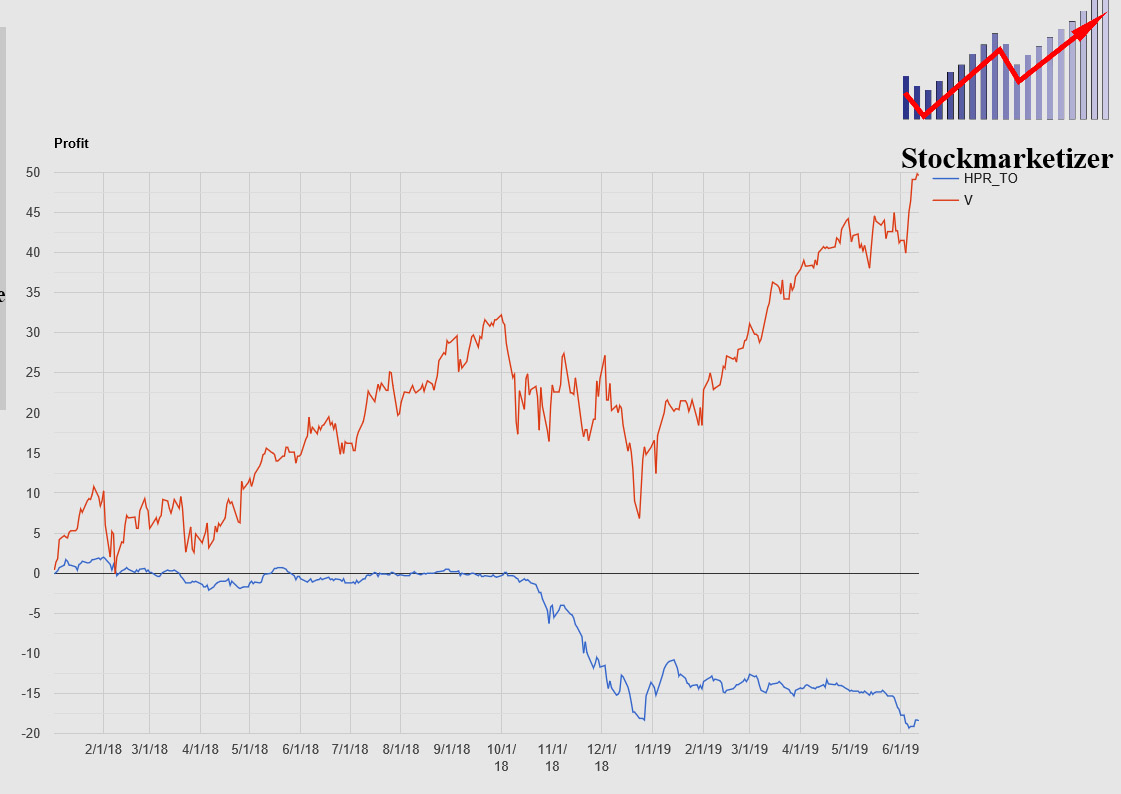
June 12, 2019
Visa (V) is up 50% since 2018. The below graph compares Visa to dividend stocks like Horizons Preferred Shares (HPR.TO) which have been steady or have dropped over the past few years. The dividends paid out are less than the stock increase, therefore owners of that stock have actually lost value overall.
AXY Growth Since 2017
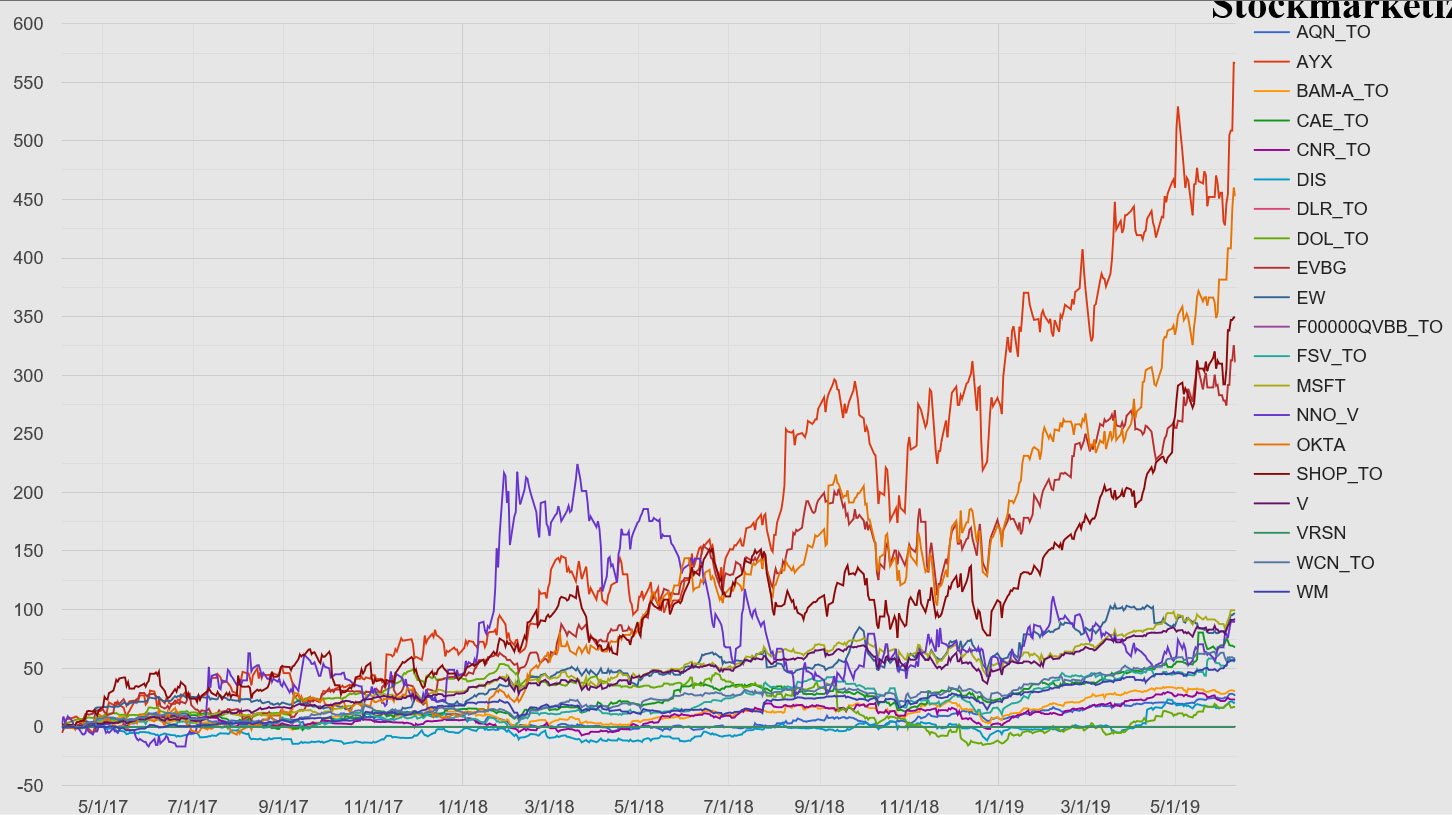
June 11, 2019
Alteryx (AXY) has had tremendous growth since 2017, up over 550%, leaving behind many popular stocks. They are continuing to purchase other companies to improve their growth, and potentially could get bought out by being compatible with larger software companies. The trend over the past few years is shown below compared to other stocks that have done very well.
Industry P/E Ratios
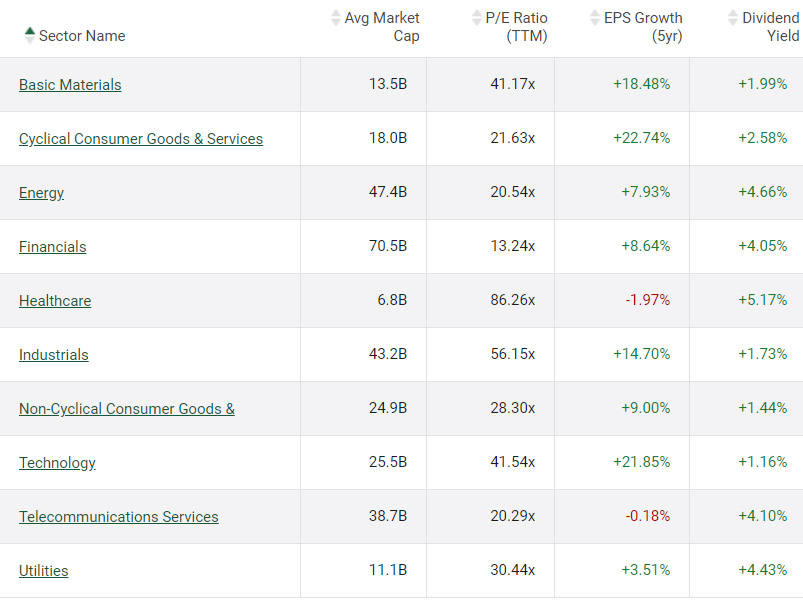
June 10 2019
The price per earnings (P/E) ratio is a measure of the stock price compared to the company value per share. It is useful for identifying how inflated the stock price is. If the price of the stock is less than the P/E ratio for its category, it is considered undervalued. The graph below shows the P/E ratios by sector, which include basic materials (41.17x), consumer cyclical goods and services (21.63x), energy (20.54x), financials (13.24x), healthcare (86.26x), industrials (56.15x), non-cyclical goods and services (28.3x), technology (41.54x), telecommunications (20.29x), and utilities (30.44x).
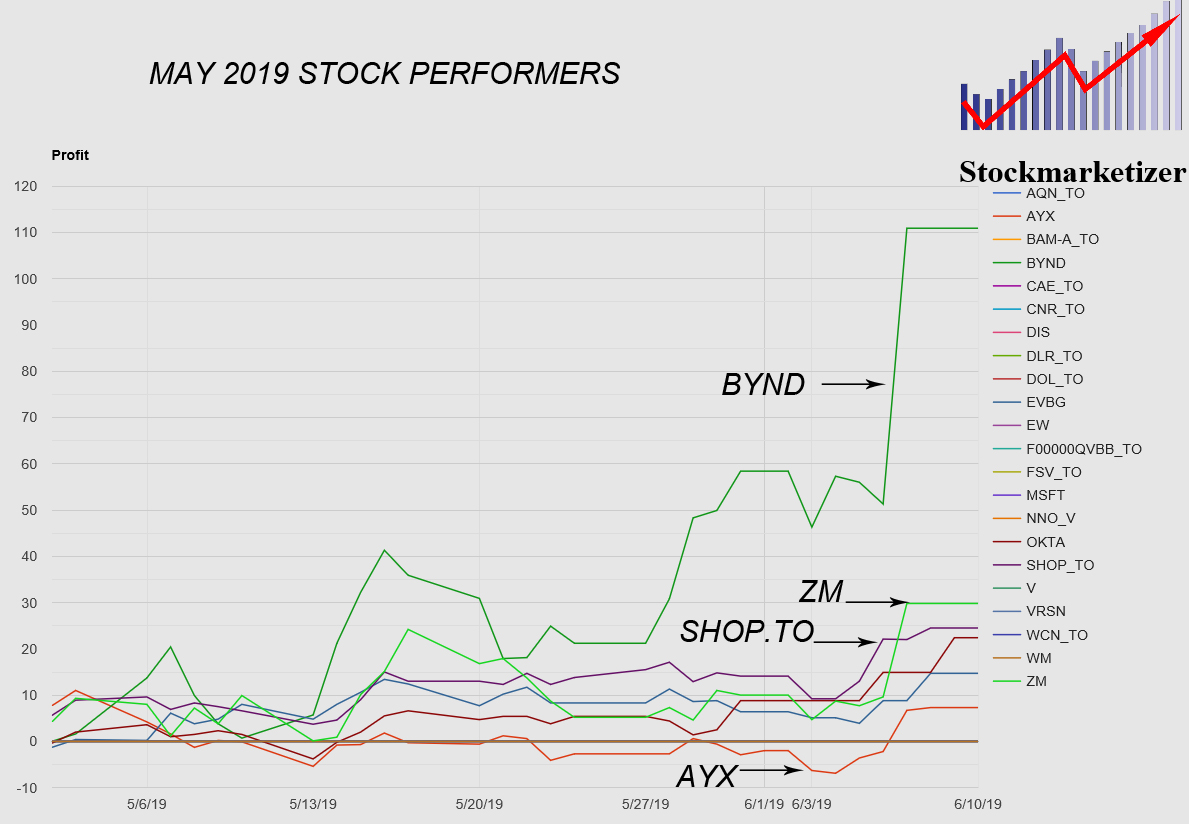
May 2019 Stock Performers
June 9 2019
May 2019 was a poor month for many stocks, however there were a few that outperformed the rest. Leading the way was Beyond Meat (BYND). As of June 6, it is up 110% since May 1st 2019, leaving its competition in the dust. Also doing very well is Zoom Video Conferencing (ZM), which is up 30% since May 1st 2019. Both of these companies recently IPOed and are experiencing rapid public investment. How long will the trend continue? Both of these companies outperformed Shopify (SHOP.TO), which despite some feeling like their cost per share is too expensive, keeps growing at an impressive rate of over 50% year over year.